
The app this map came from
Weather Navigation carries the same radar and road-surface data on Apple CarPlay and Android Auto, with a weather-aware route planner and storm-cell tracking, over the United States and southern Canada.




Scan to install Weather Navigation
Radar and live pavement conditions around Montreal — plus closures nearby and the city's six-day forecast.
Updated Sep 20, 2026 8:51 AM EDT · Mostly dry
Lowest 9°C near Saint-Hyacinthe · Highest wind 12 km/h near Laval
Use Weather Navigation for your next road trip
Montreal gets more freezing rain than any other city on this site — nearly eleven days a winter — and twice Toronto's snow, 210 cm a year that the city trucks away over four days and four nights after every big storm. This page follows the routes out — Autoroute 20 to Quebec City, the 40 to Trois-Rivières and to Ottawa, the 15 north to the Laurentians and south to the US border — with the surface condition estimated from radar and analysis along Autoroutes 20 and 40 through the island, beside what Québec 511 reports and what the City's snow removal promises.
Weather data from Sep 20, 2026 8:51 AM EDT
3 current reports on the interstates around Montreal. The 2 most serious are listed below. Always check with Québec 511 before setting off.
Between Vaudreuil-Dorion and Senneville/Montreal, on the Île-aux-Tourtes Bridge. Between 12:01 a.m. and 10 a.m. - 3 lanes, towards Montreal (EAST) and 2 lanes, towards Vaudreuil-Dorion (WEST). Between 12 p.m. and 10 p.m. - 3 lanes, WESTBOUND and 2 lanes, EASTBOUND. At all times: - Heavy vehicles prohibited from using the right-hand lane. - Overloaded vehicles prohibited
Between the Chemin du Fer-à-Cheval in Sainte-Julie and the Arthur-Branchaud Bridge in Beloeil. EASTBOUND. Reserved lane closed, 2 lanes open at all times. Traffic on diverted roads. Lane width: 3.3 meters
The five ways out of the city that matter in winter, with the distance and the clear-road time measured over openrouteservice, and what each one does to you when the weather turns.
Freezing rain more than anywhere else. Montréal-Trudeau records 10.6 days of freezing rain between November and March on Environment and Climate Change Canada's 1981–2010 normals — more than any other station on this site, twice Toronto's — because the St. Lawrence valley pools cold air under the warm fronts that ride up it from the south. The ice storm of January 1998 is the extreme; an ordinary winter has several mornings when the Métropolitaine and the bridges are glazed.
And a lot of snow: 210 cm a year on 59 days, twice Toronto's, with 11 cm on the ground on an average January day and a January that averages −9.7 °C with 23 days below freezing. The city moves it rather than melts it — loading 15 cm of snow off the streets takes a minimum of four days and four nights — so a storm's effect on the streets lasts most of a week.
The South Shore pile-ups. Autoroutes 15 and 20 south and east of the city cross flat, open farmland where blowing snow takes the visibility in seconds: on 19 February 2020 some 200 vehicles collided on Autoroute 15 at La Prairie in a whiteout, killing two, and Autoroute 20 near Saint-Hyacinthe has closed for pile-ups of dozens of vehicles more than once since. The autoroutes and the bridges are the ministry's and are reported on Québec 511; the streets are the City's.
Thirty-year normals from Environment and Climate Change Canada's station at Montréal-Trudeau International Airport, 16 km from the city centre. Averages for 1981–2010; a normal month, not this month.
| Month | Snowfall (cm) | Days with snow | Mean low (°C) | Days below 0 °C all day | Snow on the ground (cm) |
|---|---|---|---|---|---|
| Jan | 50 | 15 | -14.0 | 23 | 11 |
| Feb | 41 | 12 | -12.2 | 19 | 13 |
| Mar | 36 | 9 | -6.5 | 10 | 9 |
| Apr | 13 | 3 | 1.2 | 1 | 1 |
| May | 0 | 0 | 7.9 | 0 | 0 |
| Jun | 0 | 0 | 13.2 | 0 | 0 |
| Jul | 0 | 0 | 16.1 | 0 | 0 |
| Aug | 0 | 0 | 14.8 | 0 | 0 |
| Sep | 0 | 0 | 10.3 | 0 | 0 |
| Oct | 2 | 1 | 3.9 | 0 | 0 |
| Nov | 19 | 5 | -1.7 | 4 | 1 |
| Dec | 49 | 13 | -9.3 | 17 | 7 |
Source: Environment and Climate Change Canada, Canadian Climate Normals 1981–2010, station MONTREAL/PIERRE ELLIOTT TRUDEAU INTL A (7025250), 36 m, through the MSC GeoMet API.
The City of Montréal works in three stages. Salt and gravel go down as soon as streets and sidewalks become slippery; plowing begins as soon as 2.5 cm of snow is on the ground; and loading — the trucks that carry the snow away to the disposal sites — begins from 10 to 15 cm. In ideal conditions, collecting 15 cm of snow from the whole city takes a minimum of four days and four nights, longer if more falls meanwhile. The autoroutes and the bridges are the Ministère des Transports'.
When the forecast calls for 15 cm or more, signs go up prohibiting parking on the right-hand side of the street for the loading operation and for emergency vehicles, with the left-hand side reserved for narrow-street sticker holders from 7 pm to 9 am. The 311 Montréal app — the City's INFO-Neige — shows which streets are being cleared and when to move the car; a car left in the way is ticketed and towed.
The current plan, the map of routes and any ban in force are on montreal.ca, snow removal ↗, which is where this section was read.
Quebec is the one province with a winter tire law that applies to everyone registered there: from December 1 to March 15 every passenger vehicle registered in Québec, rental cars included, must be on tires carrying the three-peaked mountain and snowflake pictogram or on studs, and the fine for not being is $200 to $300. A vehicle registered outside Québec — an Ontario or a US plate — is exempt.
The full rule, with its sources, is on the Quebec page. What is closed right now is on Québec 511 ↗.
The same live radar and road-surface data as this map, on your phone and on Apple CarPlay or Android Auto.
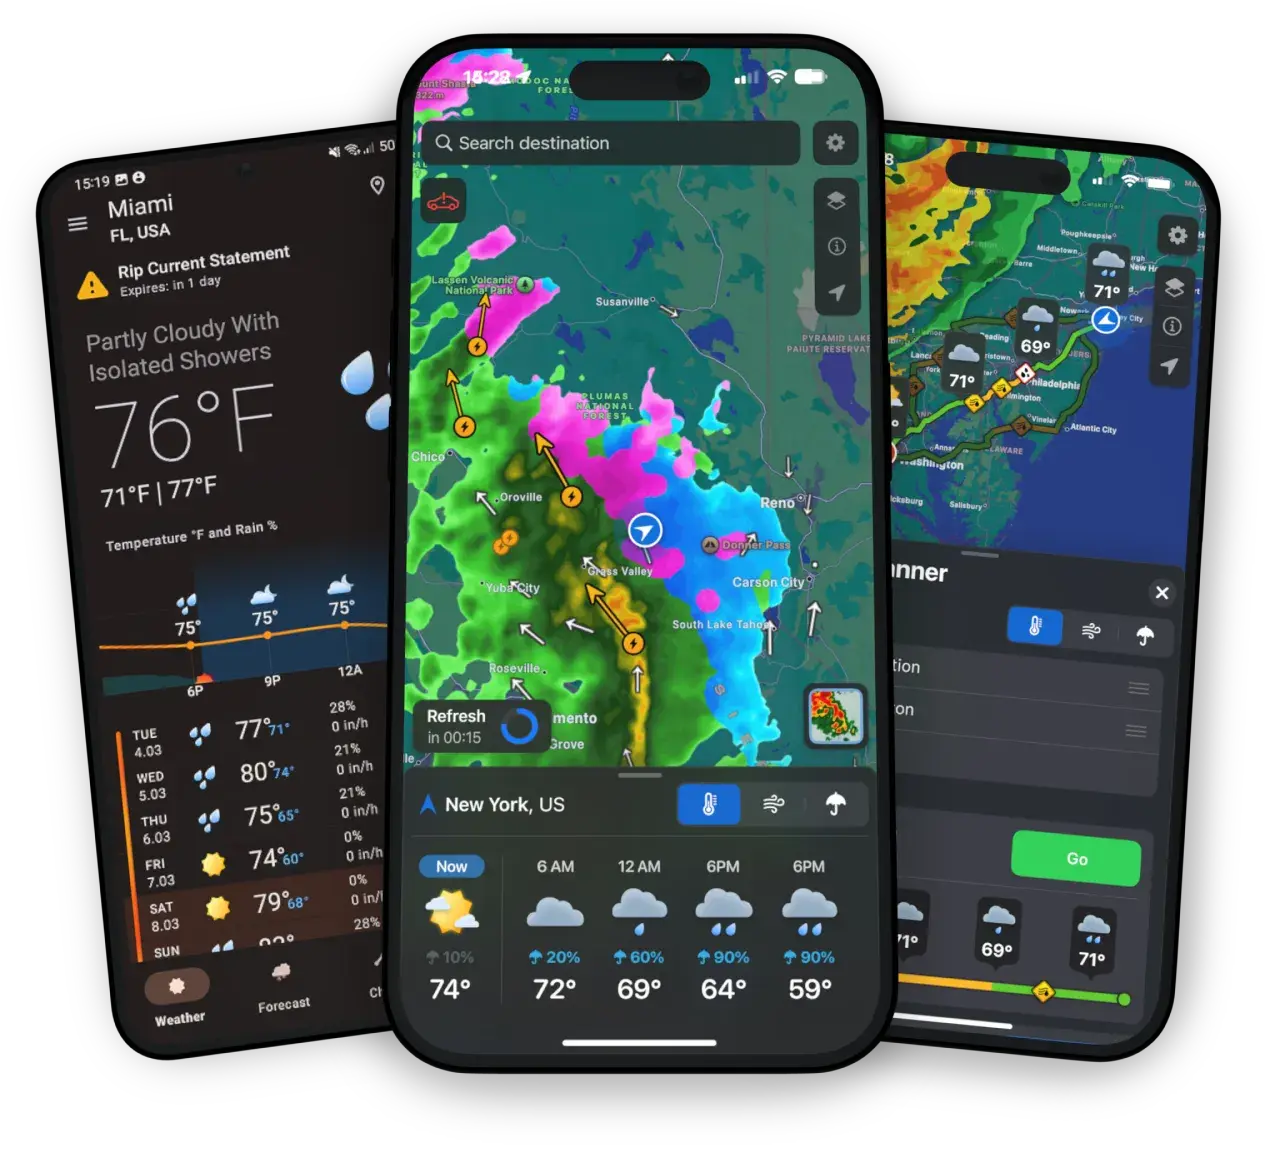
Weather Navigation carries the same radar and road-surface data on Apple CarPlay and Android Auto, with a weather-aware route planner and storm-cell tracking, over the United States and southern Canada.