
The app this map came from
Weather Navigation carries the same radar and road-surface data on Apple CarPlay and Android Auto, with a weather-aware route planner, storm-cell tracking and radar that refreshes every two minutes over the US.




Scan to install Weather Navigation

Radar and live pavement conditions on I-70, I-71, I-74, I-75 and 4 more — plus closures, road work and city-by-city weather across Ohio.
Updated Oct 8, 2026 11:11 PM EDT · Mostly dry, damp in places
Lowest 47°F near Akron, Ohio · Highest wind 8 mph near Toledo, Ohio
Use Weather Navigation for your next Road Trip
Ohio is a Midwestern state in the United States, known for Columbus, Cleveland and Cincinnati and for carrying more interstate traffic than almost any state its size: I-70 and I-71 through the middle, I-75 and I-77 north to south, and I-80 and I-90 along the Ohio Turnpike and the Lake Erie shore.
Weather data from Oct 8, 2026 11:11 PM EDT
Dry
OHGO is the traveler information map run by the Ohio Department of Transportation, at ohgo.com. It is the state's answer to what the road is doing at this minute, and ODOT publishes on it:
No full closures are reported in Ohio as of Oct 8, 2026 11:11 PM EDT, and no lane closures or roadworks either. Always check with the responsible state DOT before setting off.
Each stretch has its own live conditions, closures and cameras for the Ohio miles only — the weather 500 miles away on the same interstate says nothing about this drive.
| Place | Snow a year | Snow days | Freezing nights | Freeze–thaw days | First freeze | Last freeze | Days over 90°F |
|---|---|---|---|---|---|---|---|
| Columbus | 26.7" | 29.8 | 97.7 | 70.6 | Oct 27 | Apr 16 | 15.3 |
| Cleveland | 68.1" | 46.9 | 104.4 | 68.7 | Oct 31 | Apr 22 | 8.9 |
| Cincinnati | 11.2" | 9.8 | 104.4 | 87.3 | Oct 22 | Apr 17 | 22.2 |
| Toledo | 37.6" | 33.4 | 121.9 | 81.9 | Oct 13 | Apr 26 | 14.3 |
NOAA 1991–2020 Climate Normals, from 4 weather stations in Ohio. A dash is a figure that station does not report, not a zero.
Snowfall across Ohio is not one number: Cincinnati averages 11.2" a year and Cleveland averages 68.1".
What the road normally throws at you, month by month, from NOAA's 1991–2020 normals for Ohio's own stations. Each month names its dominant hazard and the place that measured it — this is what the month is usually like, not a forecast and not a restriction.
Summaries fetched Oct 8, 2026 8:06 AM EDT
The same live radar and road-surface data as this map, on your phone and on Apple CarPlay or Android Auto.
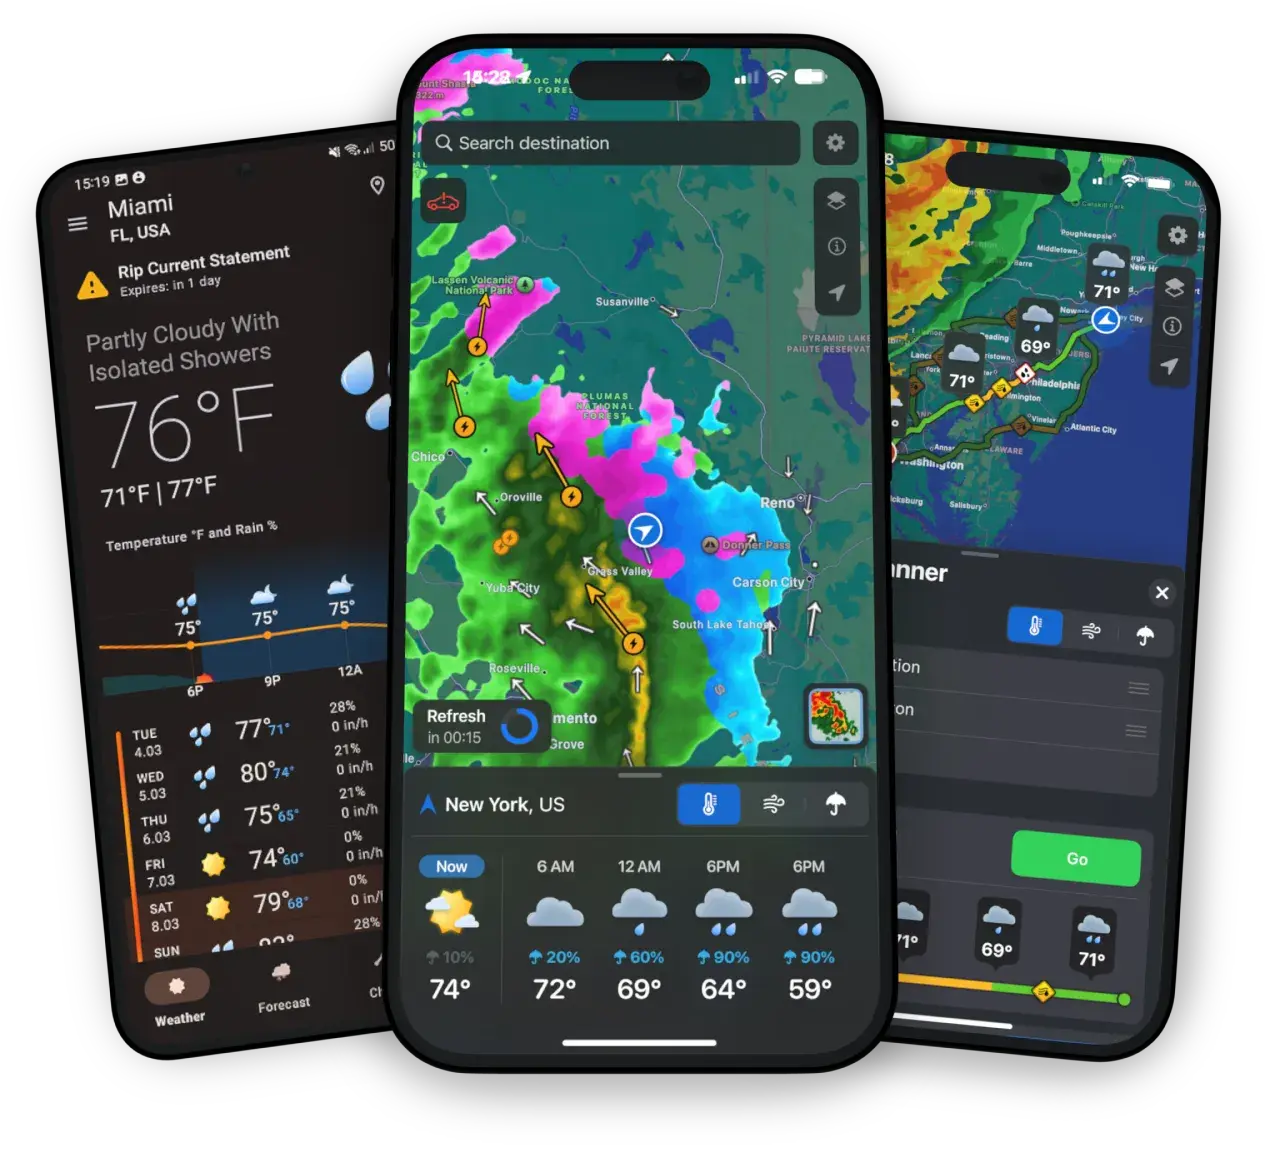
Weather Navigation carries the same radar and road-surface data on Apple CarPlay and Android Auto, with a weather-aware route planner, storm-cell tracking and radar that refreshes every two minutes over the US.