
The app this map came from
Weather Navigation carries the same radar and road-surface data on Apple CarPlay and Android Auto, with a weather-aware route planner, storm-cell tracking and radar that refreshes every two minutes over the US.




Scan to install Weather Navigation
Radar and live pavement conditions at the summit of Pennask Summit and on both climbs — plus the six-day summit forecast and the winter tire rule on Highway 97C (Okanagan Connector).
Elevation 1,728 m · Updated Sep 20, 2026 5:33 AM PDT · Mostly dry
Lowest 9°C near Peachland, British Columbia · Highest wind 19 km/h near Peachland, British Columbia
At the summit: Dry · 11°C · road surface est. 9°C · 11 km/h wind · gusting 20 km/h
Use Weather Navigation for your next Road Trip
Pennask Summit, 1,728 m, is the highest point on Highway 97C, the Okanagan Connector between Merritt and Peachland, and the highest point on the whole Coquihalla system. It is open plateau rather than a mountain pass: the hazard is wind and blowing snow across a road with nothing to stop either, and the summit stays under snow long after the valleys either side are bare.
Weather data from Sep 20, 2026 5:33 AM PDT
No full closures are reported on Pennask Summit as of Sep 20, 2026 5:33 AM PDT, and no lane closures or roadworks either. Always check with DriveBC before setting off.
Pennask Summit is on a designated winter tire and chain route. Winter tires are required on it every year from October 1 to April 30, whatever the forecast on the day, and commercial vehicles carry chains and put them on at the chain-up signs. What is in force right now — a chain-up in effect, a closure — this page does not carry; DriveBC ↗ is the authority before you set off. The rule in full, with the fines and the exceptions, is on the British Columbia page.
What this page can tell you is the surface at the summit, from radar and surface analysis: currently dry, with the road surface estimated at 9°C. The road surface figure is an estimate derived from air temperature, not a measurement — bridges and overpasses run colder than the number shown.
At the summit, 1,728 m. Each day shows its warmest and coldest hour, and the worst driving conditions forecast anywhere in it — not the average, because the hour that closes a pass is the one worth knowing about.
Rest of today Sep 20

22°C 7°C
Dry
Wind to 9 km/h
Mon Sep 21
19°C 7°C
Dry
Wind to 20 km/h
Tue Sep 22
17°C 3°C
Dry
Wind to 14 km/h
Wed Sep 23

14°C 4°C
Dry
Wind to 22 km/h
0.1 mm
precipitation
Thu Sep 24
15°C 2°C
Wet worst around 9 PM
Wind to 11 km/h
2.4 mm
precipitation
Fri Sep 25

6°C 2°C
Snow worst around 10 AM
Wind to 12 km/h
4.0 mm
precipitation
Forecast, not a measurement — from the same weather service that draws this page's radar and road colors, model run 6 hours ago. Days run on Pacific time, the clock the pass keeps — not the reader's.
Where each approach starts, how far below the summit, and how much road the climb takes. The starting points are DriveBC cameras, so the elevations are the province's own; the distances are measured along the highway's line. Snow at the summit and rain at the start is the normal state of this road for half the year, and the table says how far apart the two are.
| Approach | Starts at | Elevation | Climb to the summit | Over |
|---|---|---|---|---|
| From Merritt, eastbound | Aspen Grove | 1,071 m | +657 m | 50.5 km |
Exposure. The Connector is a four-lane freeway across an open plateau that stays above 1,500 m for most of the way between Aspen Grove and the summit, and there is nothing to stop the wind: drifting and whiteout close lanes here when the Okanagan below is dry. The other reason is the Peachland side — the long, steep grades out of the valley, where the first wet snow of the season catches traffic on summer tires, as it did on 29 October 2025.
The dated closures, with the province's own releases for each, are on the Highway 97C page.
Distances and times are measured over openrouteservice on a clear road, and a closure day is not one: the detour carries the closed road's traffic too. Whether the pass is open right now is on DriveBC ↗.
Thirty-year normals from the nearest Environment and Climate Change Canada station with a full record: Peachland, 26 km away and 1,383 m below the summit. The pass runs colder than these figures — roughly 0.6 °C per 100 m — and turns more of the same precipitation into snow. Averages for 1981–2010; a normal month, not this month.
| Month | Snowfall (cm) | Days with snow | Mean low (°C) | Nights ≤ 0 °C | Snow on the ground (cm) |
|---|---|---|---|---|---|
| Jan | 24 | 6 | -2.4 | 20 | 6 |
| Feb | 10 | 3 | -1.6 | 17 | 3 |
| Mar | 5 | 1 | 1.1 | 11 | 0 |
| Apr | 0 | 0 | 4.5 | 2 | 0 |
| May | 0 | 0 | 8.7 | 0 | 0 |
| Jun | 0 | 0 | 12.6 | 0 | 0 |
| Jul | 0 | 0 | 15.6 | 0 | 0 |
| Aug | 0 | 0 | 15.3 | 0 | 0 |
| Sep | 0 | 0 | 10.6 | 0 | 0 |
| Oct | 0 | 0 | 5.6 | 2 | 0 |
| Nov | 13 | 3 | 1.1 | 10 | 1 |
| Dec | 31 | 8 | -2.5 | 22 | 4 |
Source: Environment and Climate Change Canada, Canadian Climate Normals 1981–2010, station PEACHLAND (1126070), 345 m, through the MSC GeoMet API.
The same live radar and road-surface data as this map, on your phone and on Apple CarPlay or Android Auto.
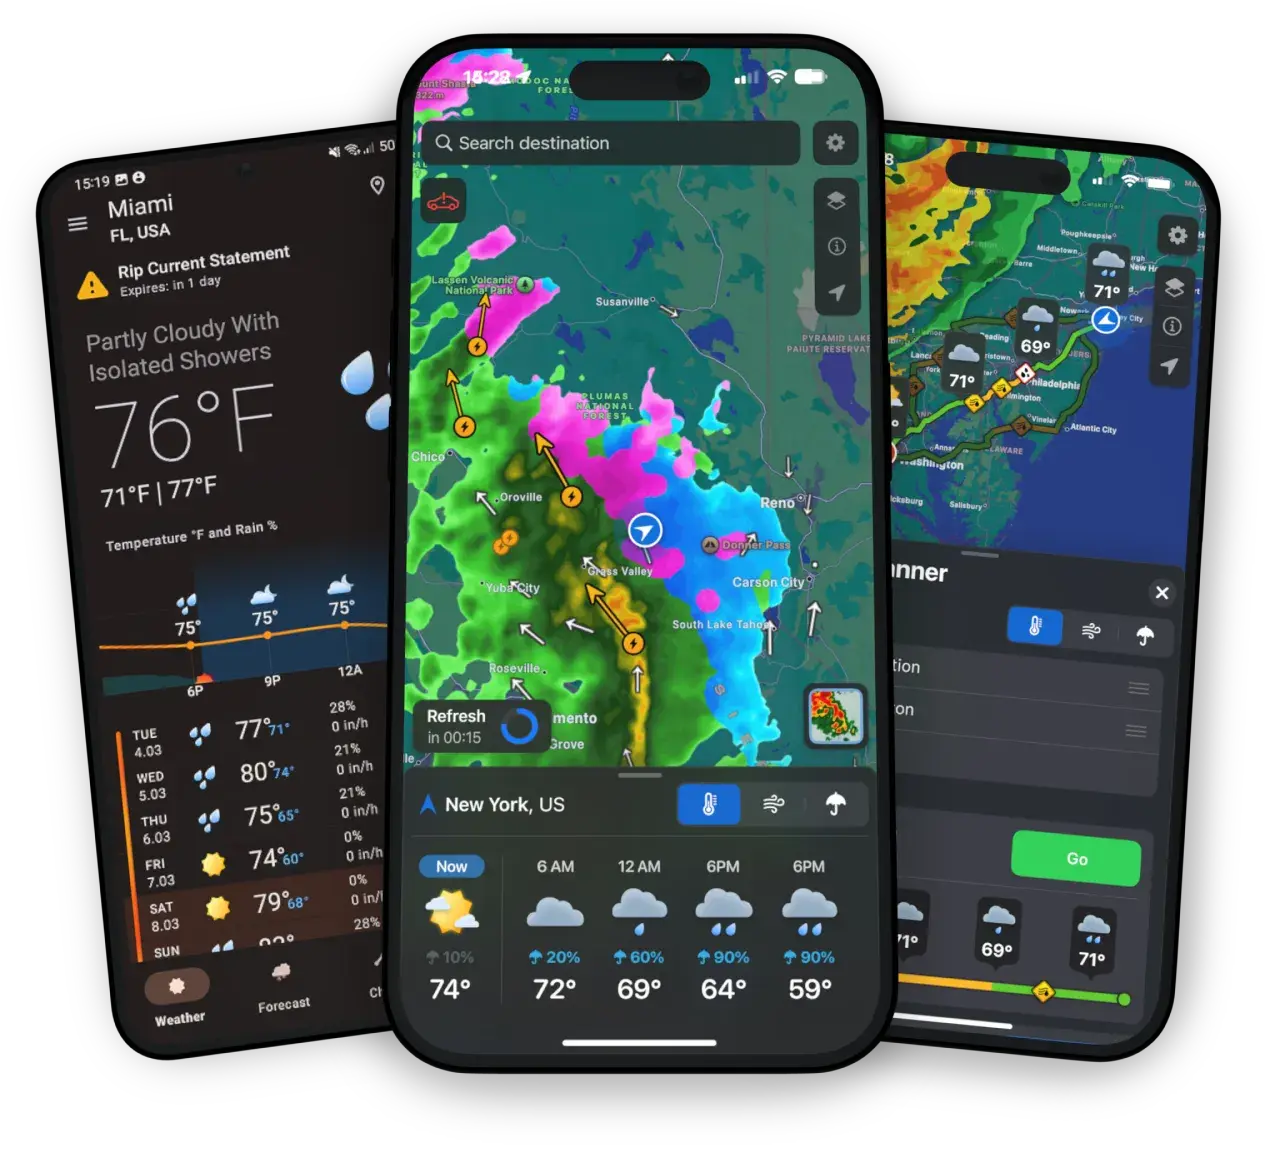
Weather Navigation carries the same radar and road-surface data on Apple CarPlay and Android Auto, with a weather-aware route planner, storm-cell tracking and radar that refreshes every two minutes over the US.